Tuesday, August 30, 2005
July '05 Printing Shipments
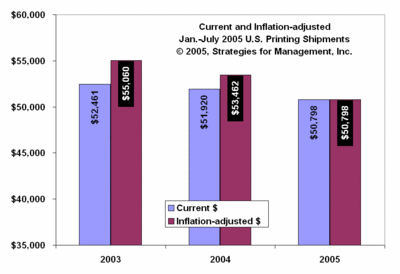
 The Commerce Department released print shipments data for July 2005, and they were down -$411 million from July 2004. Earlier in the month, they issued revised multi-year data for all manufacturing industries. The data were generally revised lower, and I will discuss these at my presentation on Tuesday, September 13 at Print 05. Be sure to sign up. Using the revised historical data, the industry is now running -2.2% behind last year in current dollars, or -5.0% on an inflation-adjusted basis. We're running at an $87 billion annual rate in current dollars.
Commerce data: http://www.census.gov/indicator/www/m3/prel/pdf/s-i-o.pdf
Signup for Print05: http://members.whattheythink.com/home/p05event.cfm
How we now rank with other major manufacturing industries in terms of percentage change in shipments compared to 2004 (current dollars basis):
Petroleum and coal products +29.1
Primary metals +12.6
Computers and electronic products +11.4
Machinery +10.2
Nonmetallic mineral products +9.5
Miscellaneous durable goods +9.5
Furniture and related products +9.4
Nondurable goods industries +8.9
All manufacturing industries +7.3
Plastics and rubber products +7.3
Food products +6.9
Chemical products +6.9
Fabricated metal products +6.8
Paper products6.8
1st half 2005 current GDP growth +6.5
Electrical equipment, appliances, and components +6.4
Durable goods industries +6.0
Wood products +2.3
Textile products +1.7
Apparel +0.3
Leather and allied products +0.1
Beverage and tobacco products -0.2
Transportation equipment -1.9
Printing -2.2
Textile mills -5.5


