Friday, July 29, 2005
Profit Laggards Unmasked
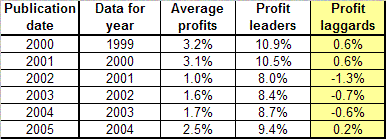
The PIA Financial Ratios are a valuable industry resource. On June 30, PIA released their 2005 report of 2004's profitability. Most people read these and just look at the data on the surface. PIA reports data comparing profit leaders (the top 25%) and average profits. They do not report profit laggards. Because profit leaders data are part of the average, we don't have data about the companies that are not leaders... that is, unless you calculate it. It's not pretty. It's obvious that only the leaders make money. The others barely break even.

Bob Rosen brought this to my attention a few years ago. I didn't believe it then until I calculated it myself.
When reading the PIA release, it's easy to say that for 2004, profit leaders were almost 4x more profitable than the average printer (9.4% vs. 2.5%; the actual difference is 3.76x). But the real calculation is the difference between profit leaders and "laggards." It's really 47x! (9.4% vs. 0.2%).
All data are from the PIA release except for the column in yellow, which are the result of my calculations using the PIA data.
![]()


